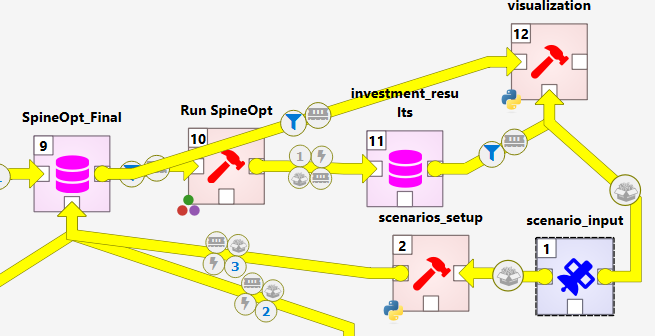
This page explains how to use the Pan‑European Framework visualization tool within your Spine Toolbox workflow to explore results produced by SpineOpt.
Repository path:
src/_visualization/
Overview
The visualization tool is a Python utility (visualization.py) that reads a SpineOpt results database and the corresponding SpineOpt model database, processes the outcomes, and generates a set of plots such as:
- Installed capacity by technology and year
- New investments and decommissioning over time
- Energy production by technology
- A map of installed capacity distribution across Europe
- Cumulative investment costs over the modelling horizon
- Sankey diagrams for energy and emissions
- A map of cross‑border flows for relevant energy carriers
Configuration files under _visualization/config control friendly names, scenario/technology mappings, and geospatial layers for map figures. Edit these files to customize labels or to add/update shapefiles and region definitions.
Prerequisites
- A working Spine Python environment (e.g., the environment you use to run Spine Toolbox/SpineOpt)
- Access to:
- the SpineOpt results DB (output of your simulation)
- the SpineOpt model DB (matching the run that produced the results)
- the scenario configuration used for the run (see below)
- Create an output directory named
files_outundersrc/_visualization/(or your chosen working directory) to store generated figures and data artifacts.
Inputs
- Results DB: Path to the SpineOpt results SQLite database (or your configured DB engine).
- Model DB: Path to the SpineOpt model database corresponding to the same run.
- Scenario configuration: The YAML file created in the setup phase, typically located at:
src/_planning-input-processsing/scenario_config.yml
Tip: If you change technology names or add regions, update the mapping files under
_visualization/config/so the plots display the desired labels.
Streamlit app (optional)
After generating outputs, you can spin up a small Streamlit app to browse the figures and summary tables stored in files_out/:
# From src/_visualization/ (Spine Python environment active)
streamlit run app.py
- Script:
app.py - Ensure the
files_out/directory exists and contains the artifacts created byvisualization.py.
Customization
- Labels & mappings: Edit YAML/CSV mapping files in
_visualization/config/to change model and technology names displayed in plots. - Maps: Replace or extend geospatial files in
_visualization/config/to alter boundaries or add custom regions. - Figure styles: Tweak plotting parameters in
visualization.pyif you need different color palettes, aggregation levels, or time scopes.
Troubleshooting
- If maps don’t render, confirm that the geospatial files referenced in
_visualization/config/exist and match your region naming. - If no figures are produced, verify that results and model DBs are from the same run and that paths are correct.
- If you see argument errors, run
python visualization.py -hto confirm the available flags for your version/branch.