How to manage Output Data
Once a model is created and successfully run, it will hopefully produce results and output data. This section covers how the writing of output data is controlled and managed.
Specifying Your Output Data Store
In your workflow (for more details see Create a workflow for SpineOpt in Spine Toolbox) you will normally have an output datastore connected to your RunSpineOpt workflow tool. This is where your output data will be written. If no output datastore is specified, the results will be written by default to the input datastore. However, it is generally preferable to define a separate output data store for results. See Create a workflow for SpineOpt in Spine Toolbox for the steps to add an output datastore to your workflow.
Specifying Outputs to Write
Outputting of results to the output datastore is controlled using the output and report entity classes. To output a specific variable to the output datastore, we need an output entity of the same name. For example, to output the unit_flow variable, we need an output entity named unit_flow. The SpineOpt template contains output entities for the problem variables, objective cost terms and constraint duals, and importing or re-importing the SpineOpt template will add these to your input datastore. So it is probable these output entities already exist in your input datastore. Once the output entities exist in your model, they must then be added to a report by creating a report__output entity.
Creating Reports
Reports are essentially a collection of outputs that can be written to an output datastore. Any number of reports can be created. We add output items to a report by creating report__output entities between the outputs we want included and the desired report. Finally, to write a specific report to the output database, we must create a model__report entity for each report we want included in the output datastore.
For example, to add units_on to an existing report called report1:
- In the Spine DB Editor of your input database, right-click report__output in the Entity tree and select Add entities...
- Select
report1as the report andunits_onas the output, then click OK. - Commit the changes and run the model again.
To see which outputs a report contains, expand report__output in the Entity tree. Note that the Parameter value table only lists the report__output entities that have parameter values, so it does not show the whole report. To stop writing an output, right-click its report__output entity and select Remove...
Reporting of Input Parameters
In addition to writing results as outputs to a datastore, SpineOpt can also report input parameter data. To allow specific input parameters to be included in a report, they must be first added as output entities with a name corresponding exactly to the parameter name. For example, to allow the demand parameter to be included in a report, there must be a correspondingly named output entity called demand. If the name does not match a parameter, nothing is reported for it and only a warning is printed in the Julia console. The name of the report is free to choose. Similarly to outputs, to include an input parameter in a report, we must create a report__output entity between the output representing the input parameter (e.g. demand) and the desired report.
In the output datastore, the input parameter appears under the class of the entities it is defined for, with the report and stochastic scenario added as dimensions. For example, demand is defined for nodes, so its values appear in the report__node__stochastic_scenario class.
Reporting of Dual Values
To report the dual of a constraint, add the output with the corresponding constraint name to a report. The SpineOpt template already contains these outputs, named constraint_ followed by the constraint name (e.g. constraint_nodal_balance or constraint_units_available). The constraint_ prefix avoids ambiguity with variable names. The corresponding constraint's marginal value is then reported in the output DB. For example, the dual of constraint_nodal_balance is the marginal price of the commodity at that node, and it appears in the report__node__stochastic_scenario class.
To report the reduced_cost() for a variable which is the marginal value of the associated active bound or fix constraints on that variable, add the output with the variable name prepended by bound_. So, to report the unitson reducedcost value, one would add the output called bound_units_on to a report. This will cause the reduced cost of unitson in the final fixed LP to be written to the output db. Finally, if any constraint duals or reducedcost values are requested via a report, calculate_duals is set to true and the final fixed LP solve is triggered.
Output Data Temporal Resolution
To control the resolution of report data (both output data and input data appearing in reports), we use the output_resolution output parameter. For the specific output (or input), this indicates the resolution at which the values should be reported. If output_resolution is null (the default), results are reported at the highest available resolution that will follow from the temporal structure of the model. If output_resolution is a duration value, then the average value is reported. For example, setting output_resolution to the duration 1D reports daily averages.
Output Data Structure
The structure of the output data will follow the structure of the input data with the inclusion of additional dimensions as described below:
- The report to which the output data items belong will be added as a dimension
- The relevant stochastic scenario will be added as a dimension to all output data items. This allows for stochastic data to be written to the output datastore. However, in deterministic models, the single deterministic scenario will still appear as an additional dimension
- For unit flows, the flow direction is added as a dimension to the output.
Example: unit flow
For example, consider the unit_flow optimisation variable. This variable is dimensioned on the unit__to_node and node__to_unit entity classes. In the output datastore, the report, stochastic_scenario and flow direction are added as additional dimensions. Therefore, unit__to_node values will appear in the output datastore as timeseries parameters associated with the report__unit__node__direction__stochastic_scenario class as shown below.
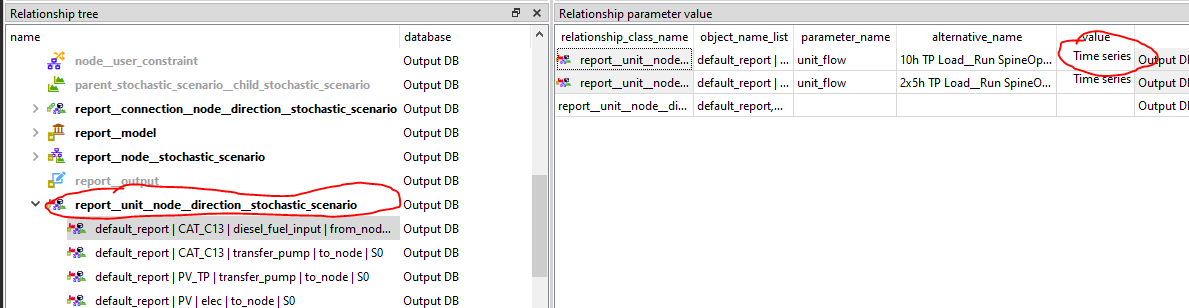
To view the data, simply double-click on the timeseries value
Example: units_on
Consider the units_on optimisation variable. This variable is dimensioned on the unit entity class. In the output datastore, the report and stochastic_scenario are added as additional dimensions. Therefore, units_on values will appear in the output datastore as timeseries parameters associated with the report__unit__stochastic_scenario class as shown below.

To view the data, simply double-click on the timeseries value
Alternatives and Multiple Model Runs
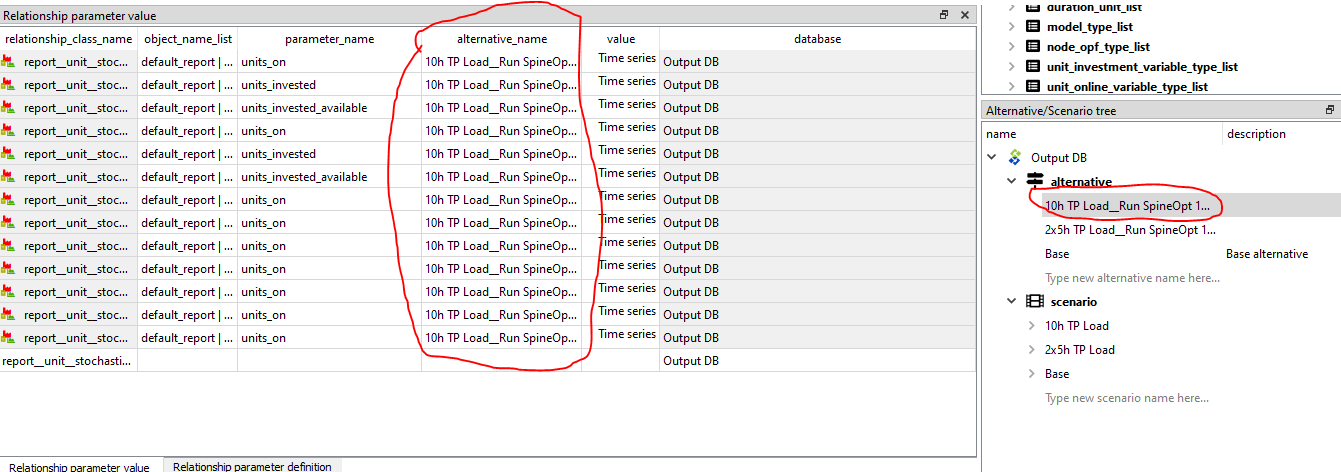
- All outputs from a single run of a model will be tagged with a unique "alternative". Alternatives allow multiple values to be specified for the same parameter. If a model is run multiple times, the results will be appended to the output datastore with a new alternative which uniquely identifies the scenario and model run. This is convenient as it allows results from multiple runs and for multiple scenarios to be viewed and compared simultaneously. If a specific alternative is not selected (the default condition) the results for all alternatives will be visible. If a single alternative is selected or multiple alternatives are selected in the alternative tree, then only the results for the selected alternatives will be shown.
In the example below, the class report__unit__stochastic_scenario is selected in the Entity tree, therefore results for that class are showing in the Parameter value table. Furthermore, in the alternative tree, the alternative 10h TP Load _Reun SpineOpt... is selected, meaning only results for that alternative are being displayed.
Viewing results as a table
To see the results of one run as a table:
- Open the output database in the Spine DB Editor.
- Click Index in the toolbar to switch to the pivot table view.
- Select the class you want to view in the Entity tree (e.g.
report__unit__node__direction__stochastic_scenario). - In the Frozen table, select the alternative of the run you want to view. By default the Frozen table shows the oldest run, so select the newest alternative yourself if you want the latest results.
Exporting results to Excel
The SpineOpt plugin for Spine Toolbox includes an Exporter, SpineOptToTable, that writes the results from the output database to an Excel file:
- Drag SpineOptToTable from the SpineOpt plugin toolbar to the Design View.
- Connect the output database to it.
- Execute the project. The Event Log shows Wrote output_exported@SpineOptToTable.xlsx. Click the file name to open the file.
The file is saved in the project folder, under .spinetoolbox/items/spineopttotable/output/.
The file has one sheet per run (alternative) in the output database. On each sheet, the first rows are headers: the result (e.g. unit_flow), the entity (e.g. power_plant_a), and for flows the direction and node. Below them, each row is a time step. Results with a single value, such as total_costs, are on the first time step row only.
- The file contains everything in the output database. To export only some results, include only those outputs in the report (see Creating Reports).
- All runs in the output database are exported. To get only the latest run, remove the older alternatives from the output database first.
- Only results of classes with
unit,nodeormodelin their name are exported, so connection results are not included. - Each result and entity gets its own column, so for large models the file becomes very wide. An Excel sheet holds at most 16,384 columns.
- The file name is set by Output file/label in the Exporter's properties. To keep the files of earlier executions, check Time stamp output directories.
Output Writing Summary
- We need an output entity in our input datastore for each variable or marginal value we want included in a report. The SpineOpt template already contains these.
- Inputs data can also be reported. As above, we need an output entity named exactly after the input parameter we want reported
- We need to create a report to contain our desired outputs (or input parameters) which are added to our report via report__output entities
- We need to create a model__report entity to write a specific report to the output datastore.
- The temporal resolution of outputs (which may also be input parameters) is controlled by the output_resolution output duration parameter. If
null, the highest available resolution is reported, otherwise the average is reported over the desired duration. - Additional dimensions are added to the output data such as the report, stochastic_scenario and, in the case of unit_flow, the flow direction.
- Model outputs are tagged with alternatives that are unique to the model run and scenario that generated them