Hydro Power Planning
Welcome to this Spine Toolbox tutorial for building hydro power planning models. The tutorial guides you through the implementation of different ways of modelling hydrodologically-coupled hydropower systems.
Introduction
This tutorial aims at demonstrating how we can model a hydropower system in Spine (SpineOpt.jl and Spine-Toolbox) with different assumptions and goals. It starts off by setting up a simple model of system of two hydropower plants and gradually introduces additional features. The goal of the model is to capture the combined operation of two hydropower plants (Språnget and Fallet) that operate on the same river as shown in the picture bellow. Each power plant has its own reservoir and generates electricity by discharging water. The plants might need to spill water, i.e., release water from their reservoirs without generating electricity, for various reasons. The water discharged or spilled by the upstream power plant follows the river route and becomes available to the downstream power plant.
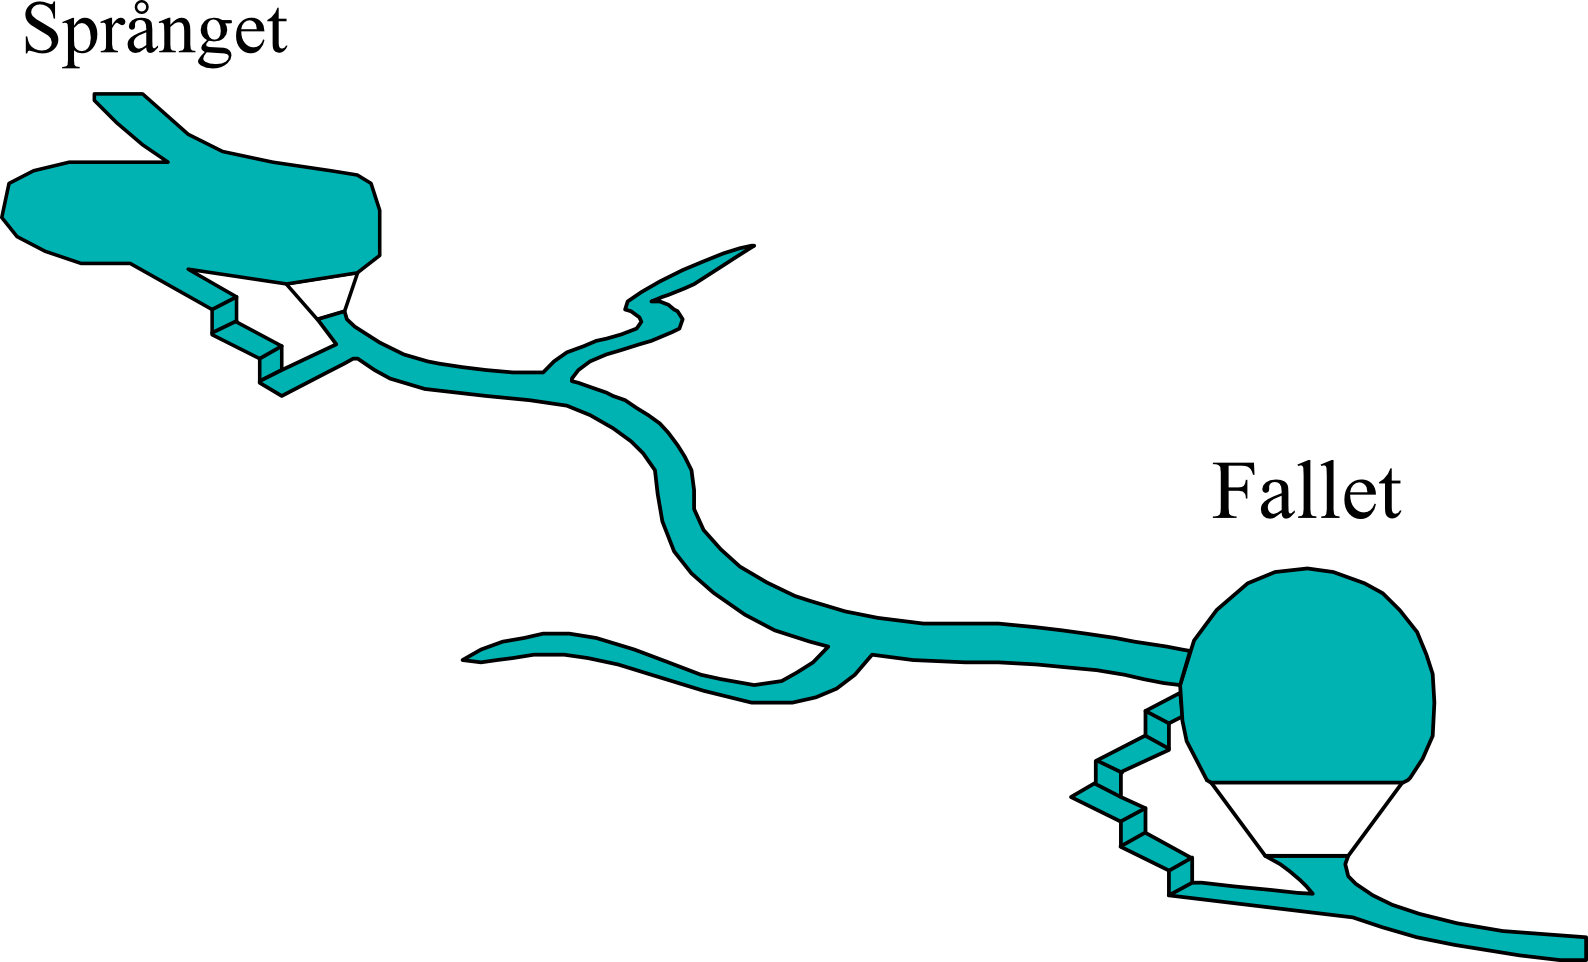
A system of two hydropower plants
In order to run this tutorial you must first execute some preliminary steps from the Simple System tutorial. Specifically, execute all steps from the guide, up to and including the step of importing-the-spineopt-database-template. It is advisable to go through the whole tutorial in order to familiarise yourself with Spine.
Just remember to give a different name for the Spine Project of the hydropower tutorial (e.g., ‘Two_hydro’) in the corresponding step, so to not mix up the Spine Toolbox projects!
That is all you need at the moment, you can now start inserting the data.
Setting up a Basic Hydropower Model
For creating a SpineOpt model you need to create Objects, Relationships (associating the objects), and in some cases, parameters values accompanying them. To do this, open the input database using the Spine DB Editor (double click on the input database in the Design View pane of Spine Toolbox).
To save your work in the Spine DB Editor you need to commit your changes (please check the Simple System tutorial for how to do that). As a good practice, you should commit often as you enter the data in the model to avoid data loss.
Defining objects
Commodities
Since we are modelling a hydropower system we will have to define two commodities, water and electricity. In the Spine DB editor, locate the Object tree, expand the root element if required, right click on the commodity class, and select Add objects from the context menu. In the Add objects dialogue that should pop up, enter the object names for the commodities as you see in the image below and then press Ok.
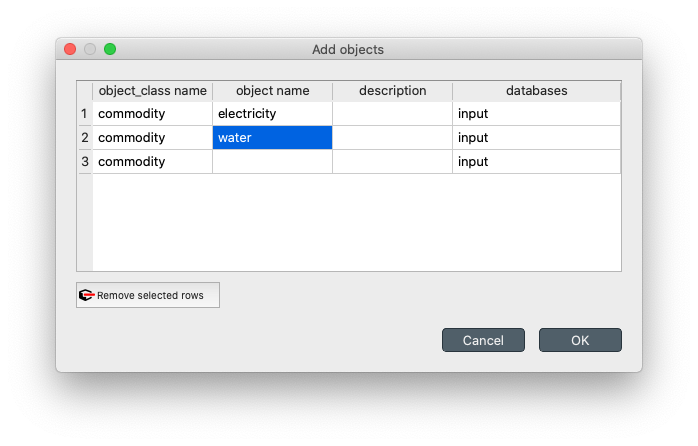
Defining commodities.
Nodes
Follow a similar path to add nodes, right click on the node class, and select Add objects from the context menu. In the dialogue, enter the node names as shown:
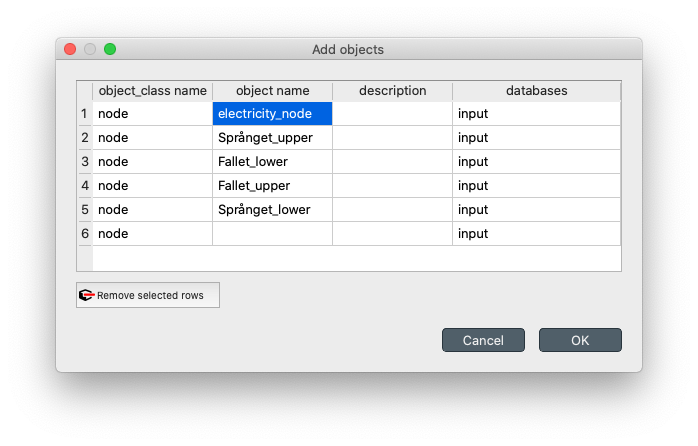
Defining nodes.
Nodes in SpineOpt are used to balance commodities. As you noticed, we defined two nodes for each hydropower station (water nodes) and a single electricity node. This is one possible way to model the hydropower plant operation. This will become clearer in the next steps, but in a nutshell, the upper node represents the water arriving at each plant, while the lower node represents the water that is discharged and becomes available to the next plant.
Connections
Similarly, add connections, right click on the connection class, select Add objects from the context menu and add the following connections:
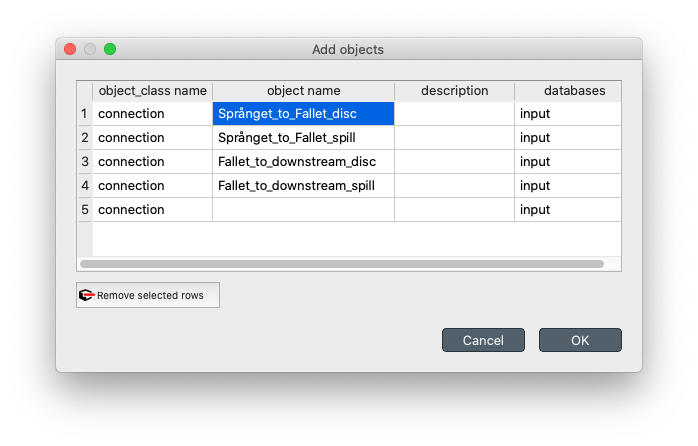
Defining connections.
Connections enable the nodes to interact. Since, for each plant we need to model the amount of water that is discharged and the amount that is spilled, we must define two connections accordingly. When defining relationships we shall associate the connections with the nodes.
Units
To convert from one type of commodity associated with one node to another, you need a unit. You guessed it! Right click on the unit class, select Add objects from the context menu and add the following units:
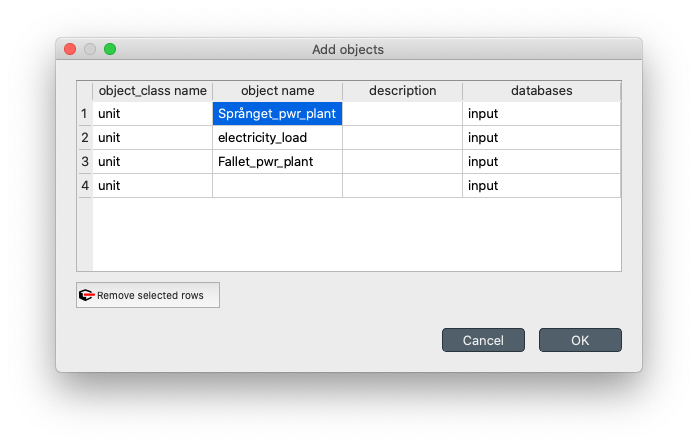
Defining units.
We have defined one unit for each hydropower plant that converts water to electricity and an additional unit that we will use to model the income from selling the electricity production in the electricity market.
Relationships
Assinging commodities to nodes
Since we have defined more than one commodities, we need to assign them to nodes. In the Spine DB editor, locate the Relationship tree, expand the root element if required, right click on the node__commodity class, and select Add relationships from the context menu. In the Add relationships dialogue, enter the following relationships as you see in the image below and then press Ok.
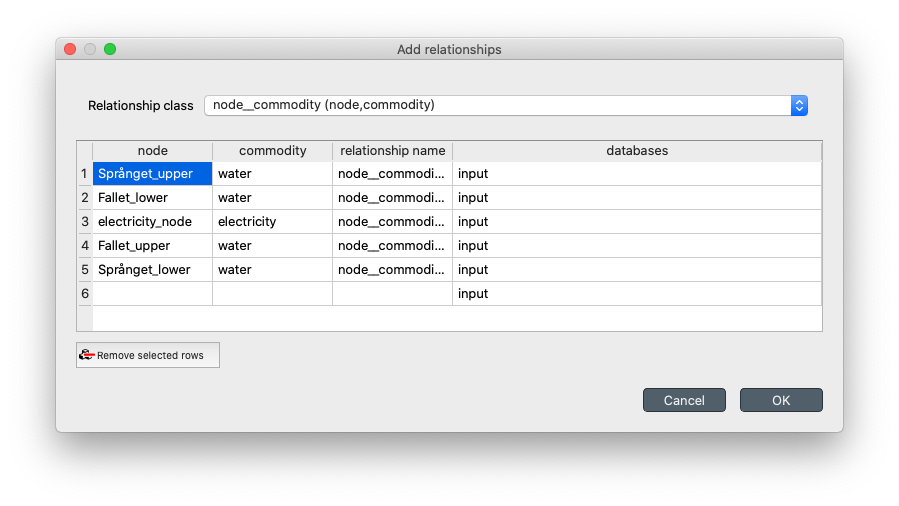
Introducing node__commodity relationships.
Associating connections to nodes
Next step is to define the topology of flows between the nodes. To do that insert the following relationships in the connection__from_node class:
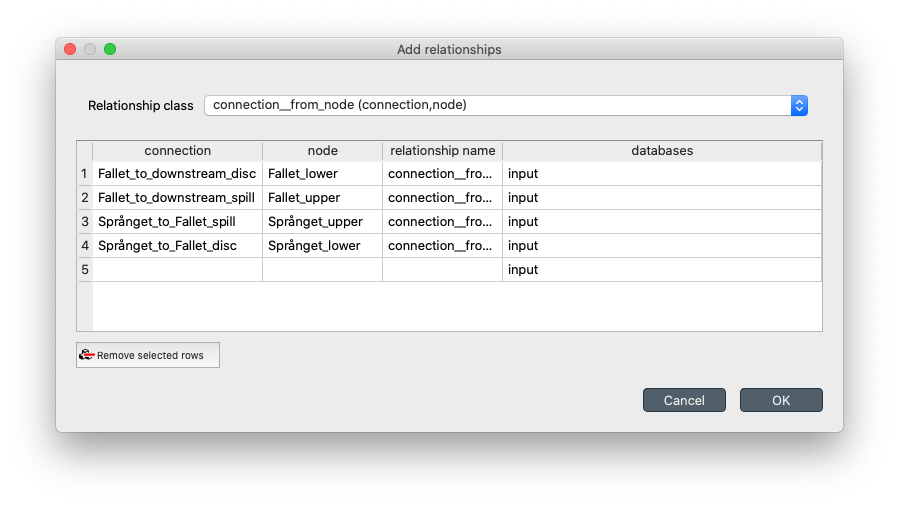
Introducing connection__from_node relationships.
as well as the following the following connection__node_node relationships as you see in the figure:
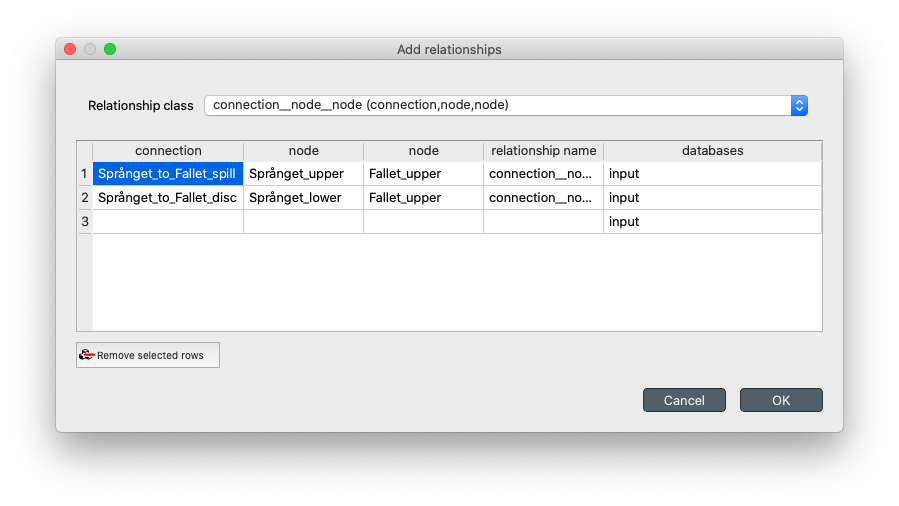
Introducing connection__node_node relationships.
Placing the units in the model
To define the topology of the units and be able to introduce their parameters later on, you need to define the following relationships in the unit__from_node class:
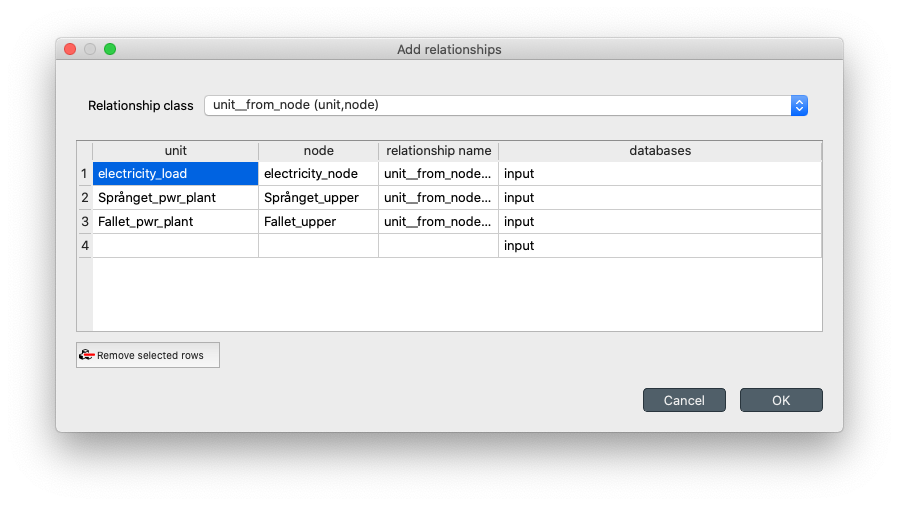
Introducing unit__from_node relationships.
in the unit__node_node class:
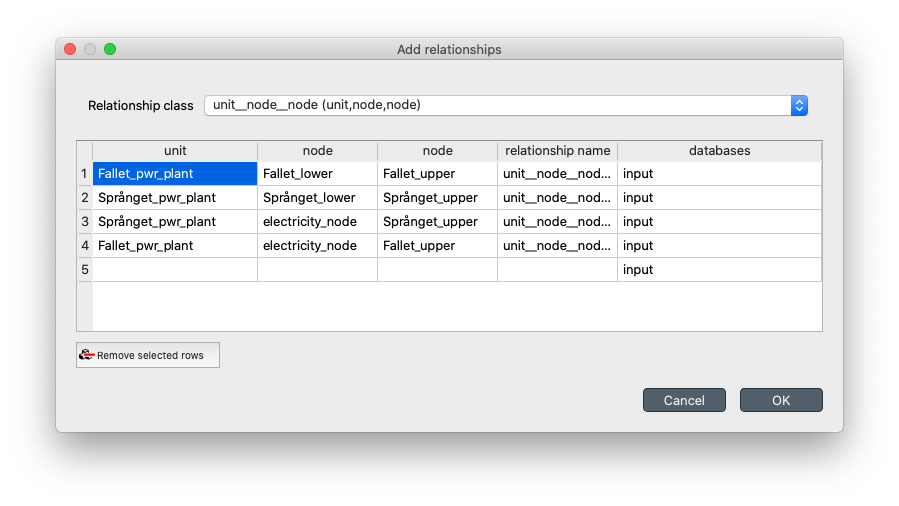
Introducing unit__node_node relationships.
and in the unit__to_node class as you see in the following figure:
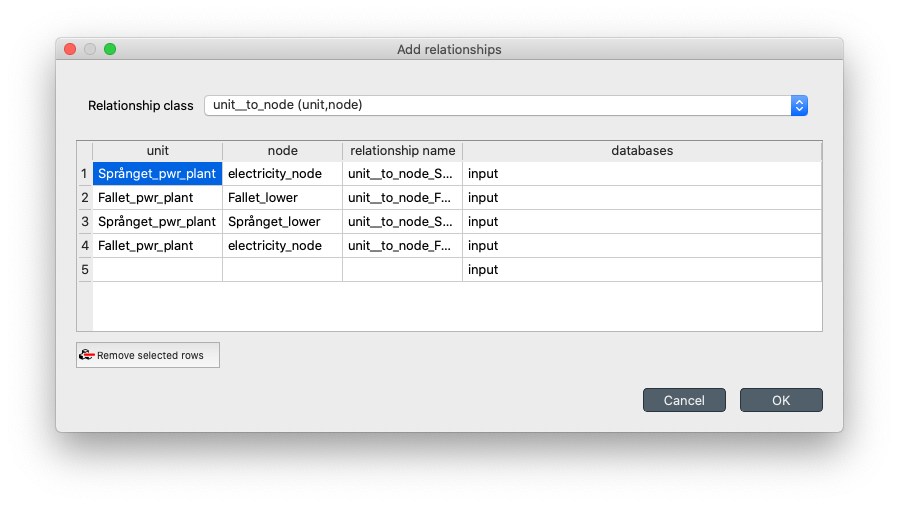
Introducing unit__to_node relationships.
Defining the report outputs
To force Spine to export the optimal values of the optimization variables to the output database you need to specify them in the form of report_output relationships. Add the following relationships to the report_output class:
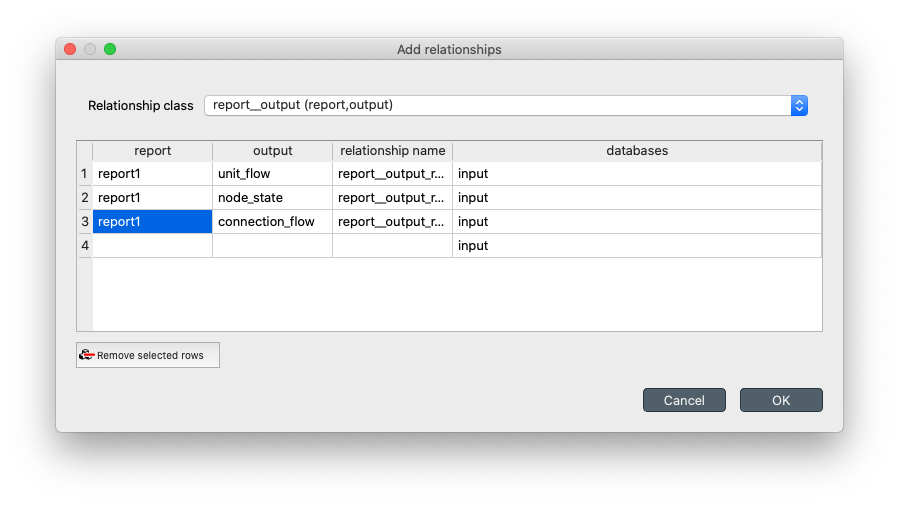
Introducing report outputs with report_output relationships.
Objects and Relationships parameter values
Defining model parameter values
The specify modelling properties of both objects and relationships you need to introduce respective parameter values. To introduce object parameter values first select the model class in the Object tree and enter the following values in the Object parameter value pane:
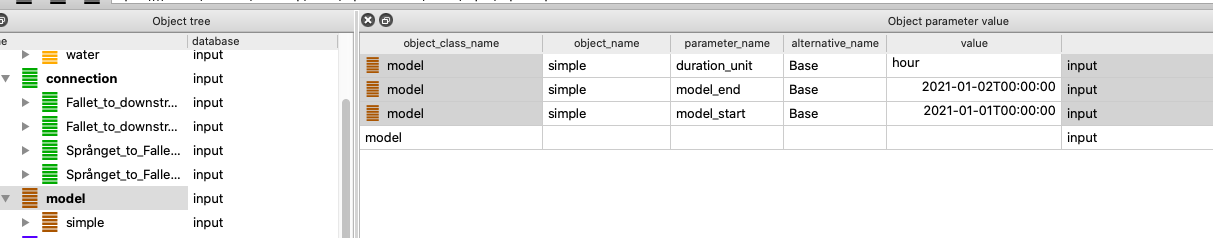
Defining model execution parameters.
Observe the difference between the Object parameter value and the Object parameter definition sub-panes of the Object parameter value pane. The first one is for the modeller to introduce values for specific parameters, while the second one holds the definition of all available parameters with their default values (these are overwritten when the user introduces their own values). Feel free to explore the different parameters and their default values. While entering data in each row you will also observe that, in most cases, clicking on each cell activates a drop-down list of elements that the user must choose from. In the case of the value cells, however, unless you need to input a scalar value or a string, you should right-click on the cell and select edit for specifying the data type of the parameter value. As you see in the figure above, for the first duration_unit parameter you is of type string, while the model_start and model_end parameters are of type Date time. The Date time parameters can be edited by right-clicking on the corresponding value cells, selecting Edit, and then inserting the Date time values that you see in the figure above in the Datetime field using the correct format.
Defining node parameter values
Going back to hydropower modelling, we need to specify several parameters for the nodes of the systems. In the same pane as before, but this time selecting the node class from the Object tree, we need to add the following entries:
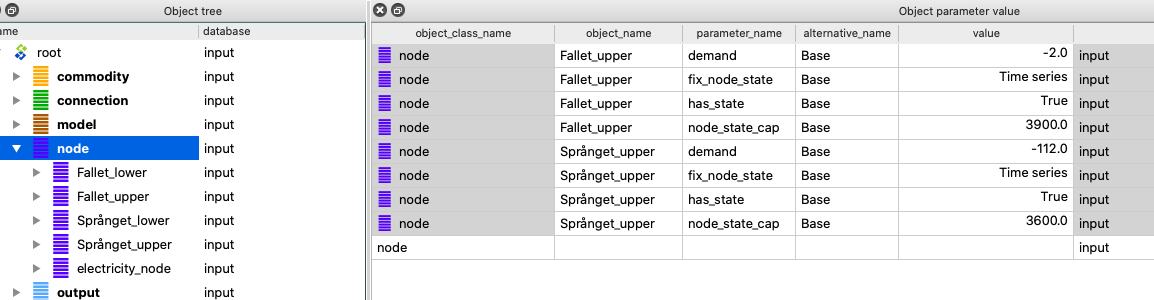
Defining model execution parameters.
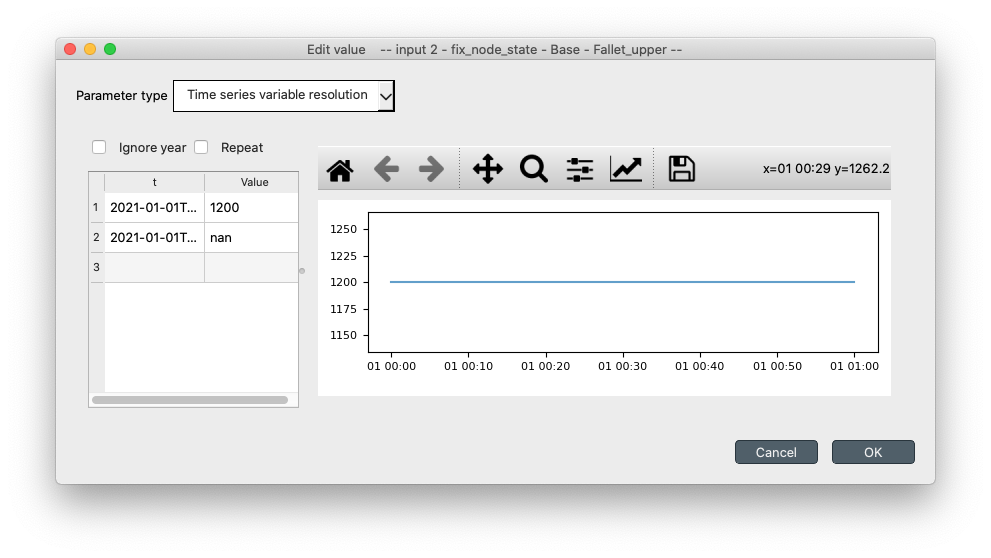
Before we go through the interpretation of each parameter, click on the following link for each fix_node_state parameter (Node state Språnget, Node state Fallet), select all, copy the data and then paste them directly in the respective parameter value cell. Spine should automatically detect and input the timeseries data as a parameter value. The data type for those entries should be Timeseries as shown in the figure above. Alternatively, you can select the data type as Timeseries and manually insert the data (values with their corresponding datetimes).
To model the reservoirs of each hydropower plant, we leverage the state feature that a node can have to represent storage capability. We only need to do this for one of the two nodes that we have used to model each plant and we choose the upper level node. To define storage, we set the value of the parameter has_state as True (be careful to not set it as a string but select the boolean true value by right clicking and selecting Edit in the respective cells). This activates the storage capability of the node. Then, we need to set the capacity of the reservoir by setting the node_state_cap parameter value. Finally, we fix the initial and final values of the reservoir by setting the parameter fix_node_state to the respective values (we introduce nan values for the time steps that we don't want to impose such constraints). To model the local inflow we use the demand parameter but using the negated value of the actual inflow, due to the definition of the parameter in Spine as a demand.
Defining the temporal resolution of the model
Spine automates the creation of the temporal resolution of the optimization model and even supports different temporal resolutions for different parts of the model. To define a model with an hourly resolution we select the temporal_block class in the Object tree and we set the resolution parameter value to 1h as shown in the figure:
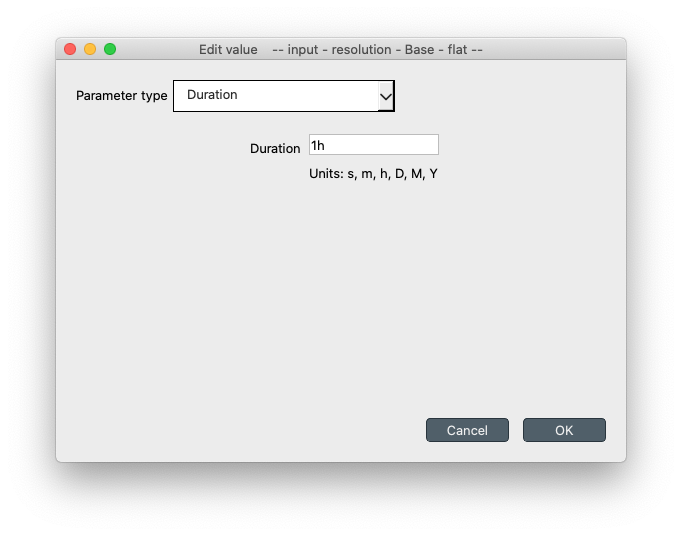
Setting the temporal resolution of the model.
Defining connection parameter values
The water that is discharged from Språnget will flow from Språnget_lower node to Fallet_upper through the Språnget_to_Fallet_disc connection, while the water that is spilled will flow from Språnget_upper directly to to Fallet_upper through the Språnget_to_Fallet_spill connection. To model this we need to select the connection__node_node class in the Relationship tree and add the following entries in the Relationship parameter value pane, as shown next:
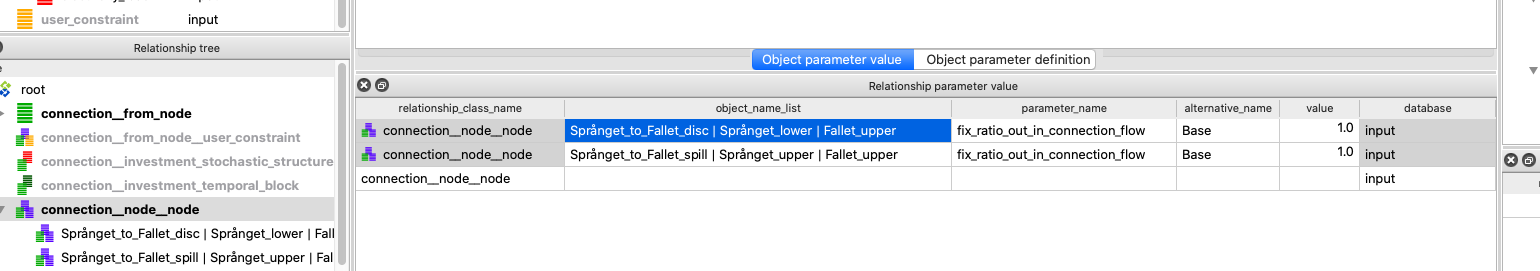
Defining discharge and spillage ratio flows.
Defining unit parameter values
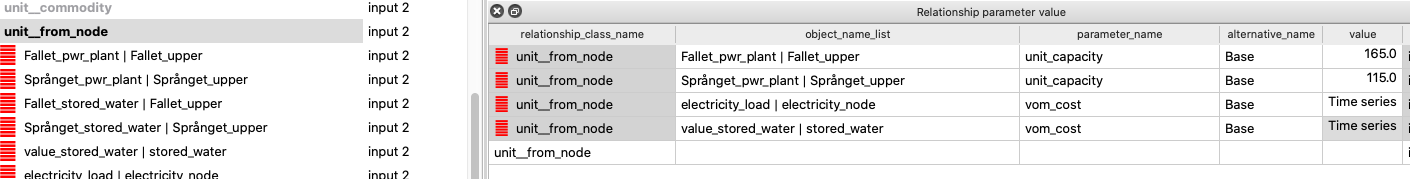
Similarly, for each one of the unit__from_node, unit__node_node, and unit__to_node relationship classes we need to add the the maximal water that can be discharged by each hydropower plant:
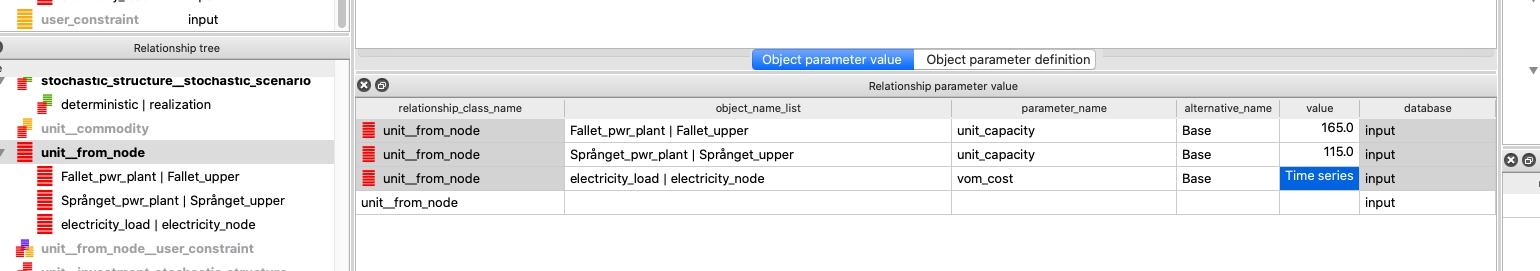
Setting the maximal water discharge of each plant.
To define the income from selling the produced electricity we use the vom_cost parameter and negate the values of the electricity prices. To automatically insert the timeseries data in Spine, click on the Electricity prices timeseries, select all values, copy, and paste them, after having selected the value cell of the corresponding row. You can plot and edit the timeseries data by double clicking on the same cell afterwards:
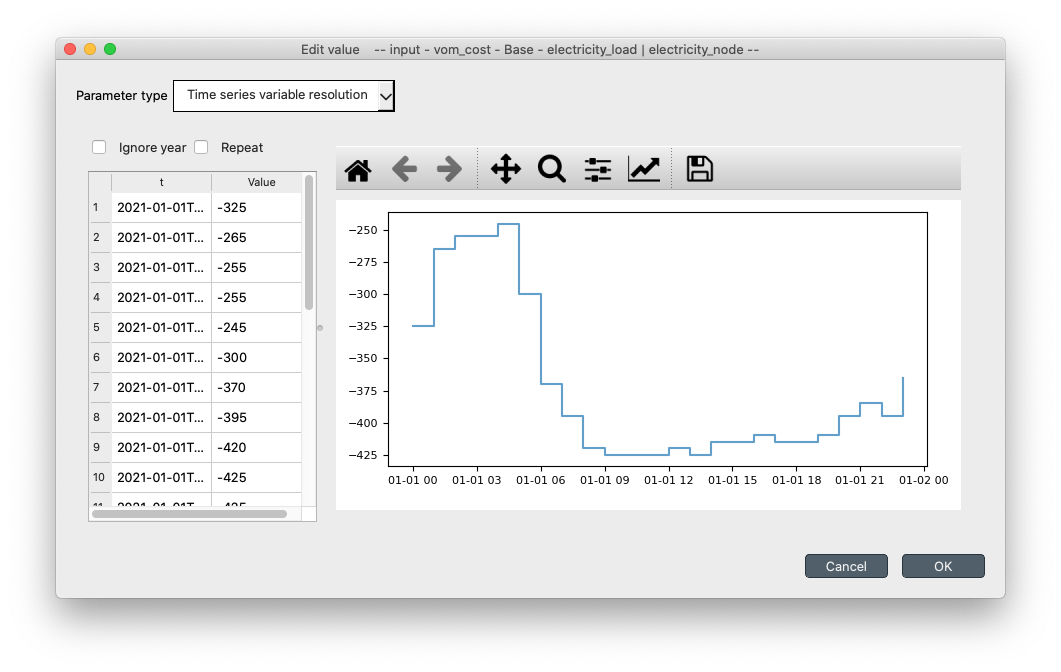
Previewing and editing the electricity prices timeseries.
Carrying on with our hydropower model we must define the conversion ratios between the nodes. Assuming that water is not "lost" from the upper node toward the lower node and electricity is produced with the discharged water with a given efficiency we define the following parameter values for each hydropower plant, in the unit__node_node class:
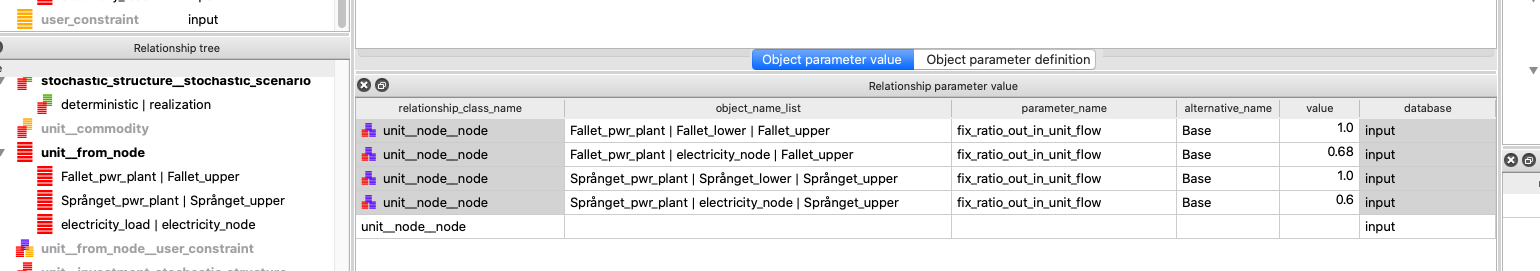
Defining conversion efficiencies.
Lastly, we can define the maximal electricity production of each plant by inserting the following unit__to_node relationship parameter values:
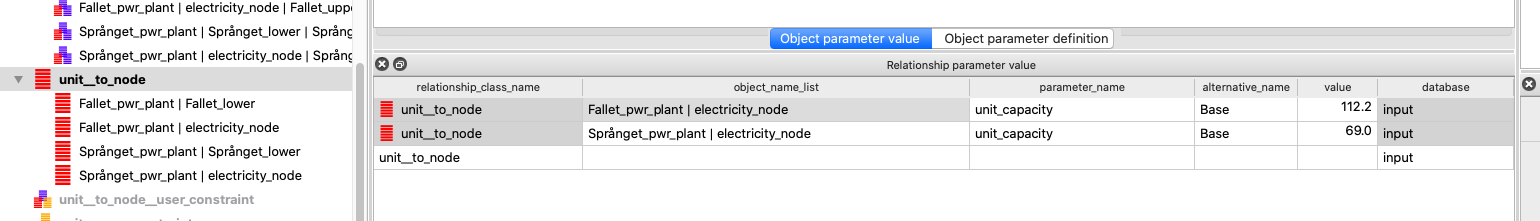
Setting the maximal electricity production of each plant.
Hooray! You can now commit the database, close the Spine DB Editor and run your model! Go to the main Spine window and click on Execute  .
.
Examining the results
Select the output data store and open the Spine DB editor. To quickly plot some results, you can expand the unit class in the Object tree and select the electricity_load unit. In the Relationship parameter value pane double click on the value cell of
report1 | electricity_load | electricity_node | from_node | realization
object name. This will open a plotting window from were you can also examine closer and retrieve the data, as shown in the next figure. The unit_flow variable of the electricity_load unit represents the total electricity production in the system:
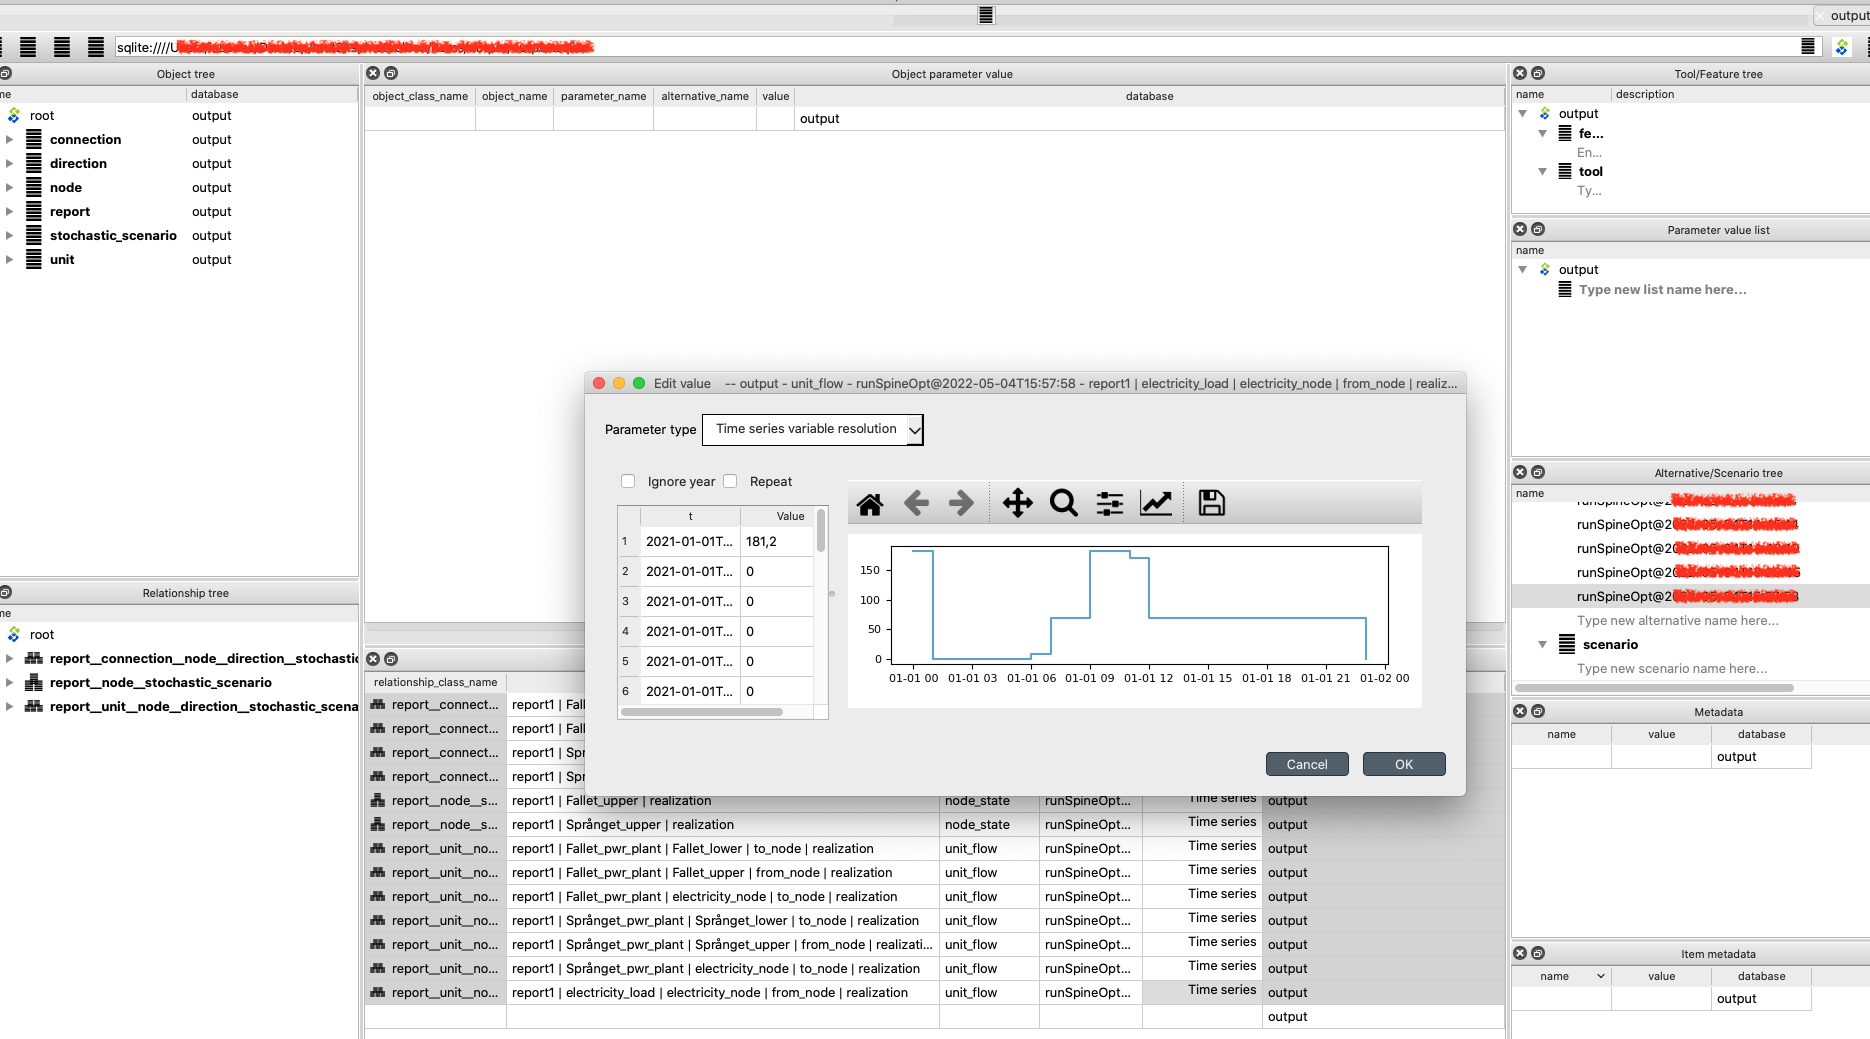
Total electricity produced in the system.
Now, take to a minute to reflect on how you could retrieve the data representing the water that is discharged by each hydropower plant as shown in the next figure:
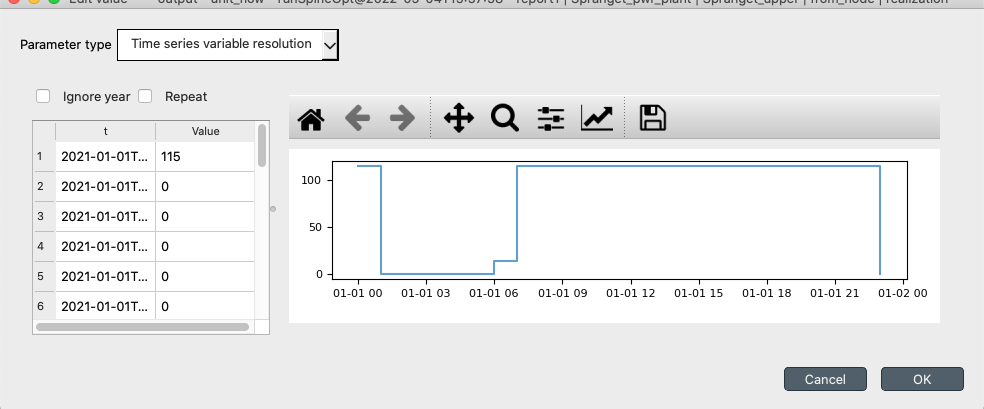
Water discharge of Språnget hydropower plant.
The right answer is that you need to select some hydropower plant (e.g., Språnget) and then double-click on the value cell of the object name
report1 | Språnget_pwr_plant | Språnget_lower | to_node | realization
or
report1 | Språnget_pwr_plant | Språnget_upper | from_node | realization
It could be useful to also reflect on why these objects give the same results, and what do the results from the third element represent. (Hint: observe the to_ or from_ directions in the object names). As an exercise, you can try to retrieve the timeseries data for spilled water as well as the water levels at the reservoir of each hydropower plant.
You can further explore the model, or make changes in the input database to observe how these affect the results, e.g., you can use different electricity prices, values for the reservoir capacity (and initialization points), as well as change the temporal resolution of the model. All you need to do is commit the changes and run your model. Every time that you run the model, your results are appended in the output database with an execution timestamp. You can however filter your results per execution, by selecting the Alternative that you want from the Alternative/Scenario tree pane. You can use the exporter too to export specific variables in an Excel sheet. Alternatively, you can export all the data of the output database by going to the main menu (Press Alt + F to display it), selecting File -> Export, then select the items that you want, click ok and export the data in Excel, or json format.
In the following, we extend this simple hydropower system to include more elaborate modelling choices.
In each of the next sections, we perform incremental changes to the initial simple hydropower model. If you want to keep the database that you created, you can duplicate the database file (right-click on the input database and select Duplicate and duplicate files) and perform the changes in the new database. You need to configure the workflow accordingly in order to run the database you want (please check the Simple System tutorial for how to do that).
Maximisation of Stored Water
Instead of fixing the water content of the reservoirs at the end of the planning period, we can consider that the remaining water in the reservoirs has a value and then maximize the value along with the revenues for producing electricity within the planning horizon. This objective term is often called the Value of stored water and we can approximate it by assuming that this water will be used to generate electricity in the future that would be sold at a forecasted price. The water stored in the upstream hydropower plant will become also available to the downstream plant and this should be taken into account.
To model the value of stored water we need to make some additions and modifications to the initial model.
First, add a new node (see adding nodes) and give it a name (e.g., stored_water). This node will accumulate the water stored in the reservoirs at the end of the planning horizon. Associate the node with the water commodity (see node__commodity).
Add three more units (see adding units); two will transfer the water at the end of the planning horizon in the new node that we just added (e.g., Språnget_stored_water, Fallet_stored_water), and one will be used as a sink introducing the value of stored water in the objective function (e.g., value_stored_water).
To establish the topology of the new units and nodes (see adding unit relationships):
- add one unit__from_node relationship, between the value_stored_water unit from the stored_water node, another one between the Språnget_stored_water unit from the Språnget_upper node and one for Faller_stored_water from Fallet_upper.
- add one unit__node__node relationship between the Språnget_stored_water unit with the stored_water and Språnget_upper nodes and another one for Fallet_stored_water unit with the stored_water and Fallet_upper nodes,
- add a unit__to_node relationship between the Fallet_stored_water and the stored_water node and another one between the Språnget_stored_water unit and the stored_water node.
Now we need to make some changes in object parameter values.
- Extend the planning horizon of the model by one hour, i.e., change the model_end parameter value to 2021-01-02T01:00:00 (right-click on the value cell, click edit and paste the new datetime in the popup window).
- Remove the fix_node_state parameter values for the end of the optimization horizon as you seen in the following figure: double click on the value cell of the Språnget_upper and Fallet_upper nodes, select the third data row, right-click, select Remove rows, and click OK.
- Add an electricity price for the extra hour. Enter the parameter vom_cost on the unit__from_node relationship between the electricity_node and the electricity_load and set 0 as the price of electricity for the last hour 2021-01-02T00:00:00. The price is set to zero to ensure no electricity is sold during this hour.
 Modify the fix_node_state parameter value of Språnget_upper and Fallet_upper nodes.
Finally, we need to add some relationship parameter values for the new units:
- Add a vom_cost parameter value on a value_stored_water|stored_water instance of a unit__from_node relationship, as you see in the figure bellow. For the timeseries you can copy-paste the data directly from this link. If you examine the timeseries data you'll notice that we have imposed a zero cost for all the optimisation horizon, while we use an assumed future electricity value for the additional time step at the end of the horizon.
 Adding vom_cost parameter value on the value_stored_water unit.
- Add two fix_ratio_out_in_unit_flow parameter values as you see in the figure bellow. The efficiency of Fallet_stored_water is the same as the Fallet_pwr_plant as the water in Fallet's reservoir will be used to produce electricity by the the Fallet plant only. On the other hand, the water from Språnget's reservoir will be used both by Fallet and Språnget plant, therefore we use the sum of the two efficiencies in the parameter value of Språnget_stored_water.
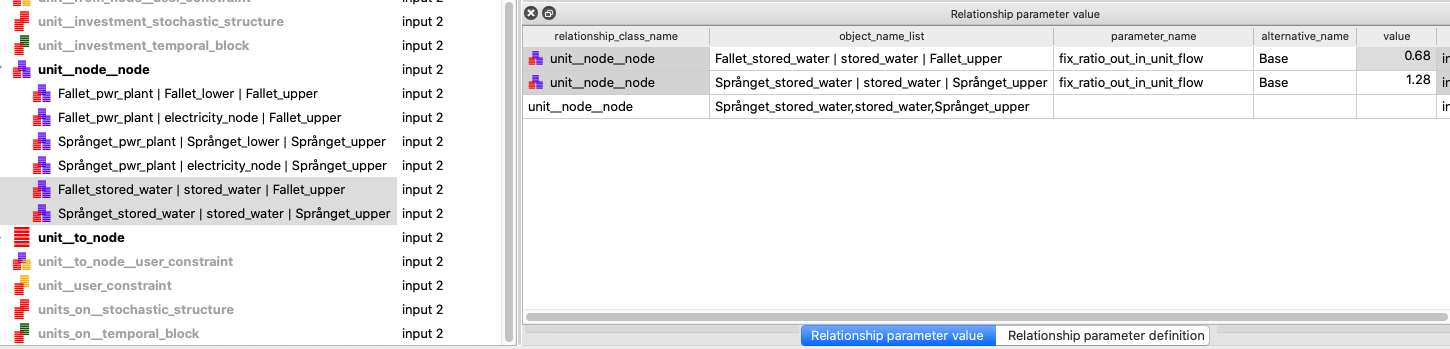 Adding fix_ratio_out_in_unit_flow parameter values on the Språnget_stored_water and Fallet_stored_water units.
You can now commit your changes in the database, execute the project and examine the results! As an exercise, try to retrieve the value of stored water as it is calculated by the model.
Spillage Constraints - Minimisation of Spilt Water
It might be the case that we need to impose certain limits to the amount of water that is spilt on each time step of the planning horizon, e.g., for environmental reasons, there can be a minimum and a maximum spillage level. At the same time, to avoid wasting water that could be used for producing electricity, we could explicitly impose the spillage minimisation to be added in the objective function.
Add one unit (see adding units) to impose the spillage constraints to each plant and name it (for example Språnget_spill).
Remove the Språnget_to_Fallet_spill connection (in the Object tree expand the connection class, right-click on Språnget_to_Fallet_spill, and the click Remove).
To establish the topology of the unit (see adding unit relationships):
- Add a unit__from_node relationship, between the Språnget_spill unit from the Språnget_upper node,
- add a unit__node__node relationship between the Språnget_spill unit with the Fallet_upper and Språnget_upper nodes,
- add a unit__to_node relationship between the Språnget_spill and the Fallet_upper node,
Add the relationship parameter values for the new units:
- Set the unit_capacity (to apply a maximum), the minimum_operating_point (defined as a percentage of the unit_capacity) to impose a minimum, and the vom_cost to penalise the water that is spilt:
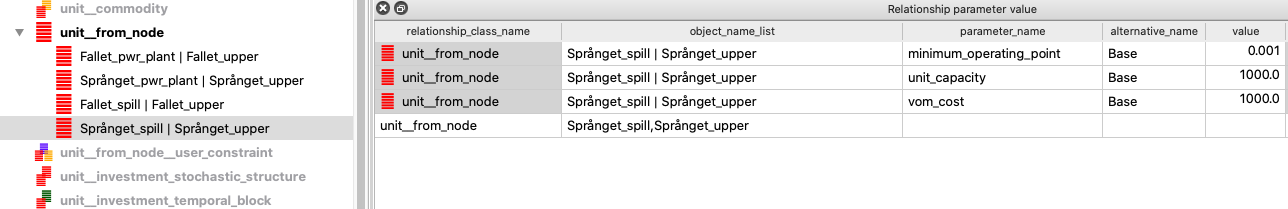
Setting minimum (the minimal value is defined as percentage of capacity), maximum, and spillage penalty.
- For the Språnget_spill unit define the fix_ratio_out_in_unit_flow parameter value of the min_spillage|Fallet_upper|Språnget_upper relationship to 1 (see adding unit relationships).
Commit your changes in the database, execute the project and examine the results! As an exercise, you can perform this process for and Fallet plant (you would also need to add another water node, downstream of Fallet).
Follow Contracted Load Curve
It is often the case that a system of hydropower plants should follow a given production profile. To model this in the given system, all we have to do is set a demand in the form of a timeseries to the electricity_node.
- Add the Contracted load timeseries, to the demand parameter value of the electricity_node (see adding node parameter values).
Commit your changes in the database, execute the project and examine the results!
This concludes the tutorial, we hope that you enjoyed building hydropower systems in Spine as much as we do!